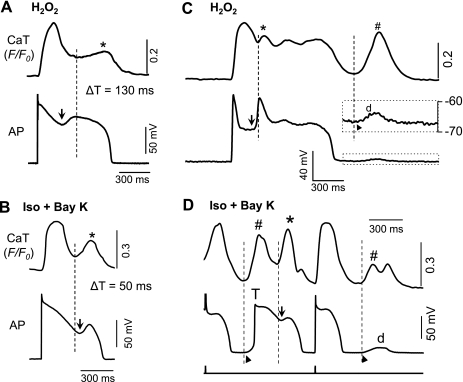
Fig. 3.
Temporal relationship between EAD and DAD corresponding SCaTs/CaWs in different models. Whole cell CaTs and APs were simultaneously recorded to compare the initiation time of an EAD upstroke (arrows) and corresponding SCaT/CaW (dashed lines). A: representative recording from H2O2 model. EAD was 130 ms ahead of corresponding SCaT. B: in Iso + BayK model, the start of a CaW preceded the upstroke of the EAD with a time difference (ΔT) of 50 ms in this representative cell. C and D: temporal relationship between DAD and CaW in H2O2 and Iso + BayK models, respectively. While the temporal relationship between EAD and SCaT remained the same as A and B, the DADs (d) and DAD-triggered APs (T) in both models seemed to always occur (as indicated by ▴) behind the initiation of their corresponding CaW (#), suggesting Ca overload and Na/Ca exchange current (INCX) as a common mechanism for the DADs in both models.

