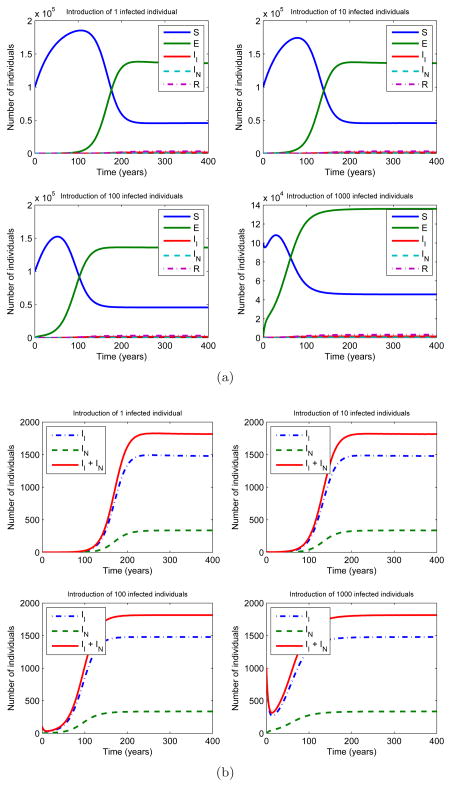
Figure 4.
(a) A numerical simulation of four tuberculosis epidemics using the model in Figure 3. The epidemics were initiated by introducing 1, 10, 100, 1000 infected and infectious individuals respectively at time zero to a fully susceptible population of 100000 (S = 100000, II = 1, 10, 100, 1000). The following parameter values were used: π = 4400, μ = 0.0222, μT = 0.139, v = 0.00256, p = 0.05, f = 0.70, q = 0.85, w = 0.005, c = 0.058, β = 0.00005. The epidemics were observed for 400 years to ensure they reach an endemic equilibrium. The plots show that all four epidemics reach endemic equilibrium in the first 200 years. As the number of infectious individuals introduced to the fully susceptible population decreases, the equilibrium time increases. (b) Number of infected individuals in four epidemics throughout the years. All epidemics have around 1800 infected individuals at equilibrium, independent of the number of infectious individuals introduced to fully susceptible population at t=0.

