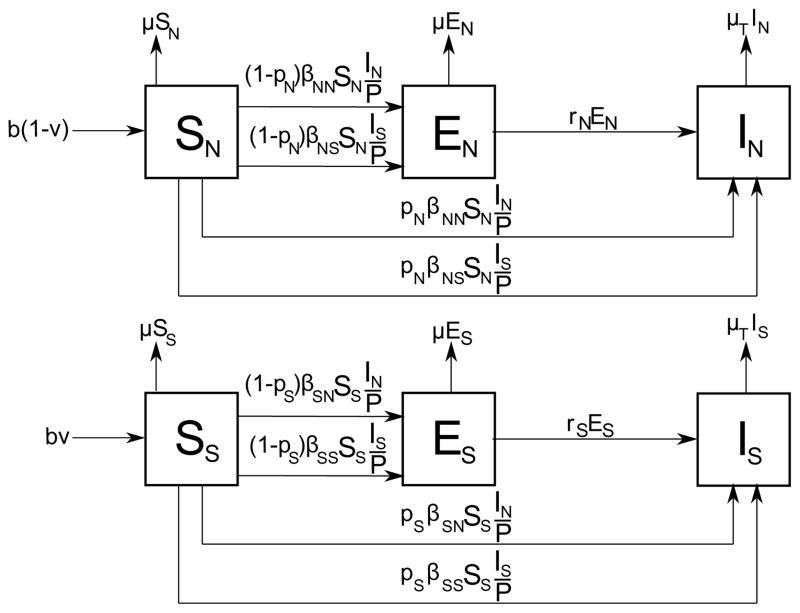
Figure 5.
TB model by Murphy et al. which captures TB dynamics in high-risk and low-risk countries. The compartments of SEI model are subdivided into two: SN, EN, IN and SS, ES, IS, where subscript N stands for neutral and denotes individuals without a susceptible genotype, and subscript S stands for susceptible and denotes individuals with a susceptible genotype. βij represents progression rate of a susceptible individual with genetic susceptibility i to active TB case with genetic susceptibility j, where i, j ∈ {S, N}. The probability pi represents direct progression rate to active TB, and ri represents reactivation rate of latent TB. The population is represented by P = SN + EN + IN + SS + ES + IS.

