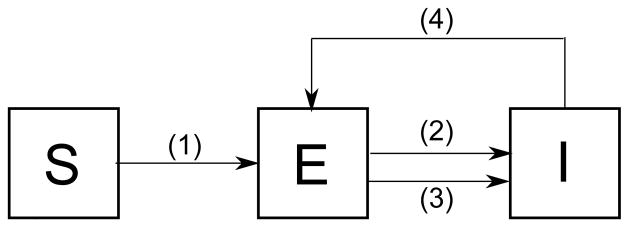
Figure 6.
Transitions showing the interaction of the individuals in the network model of Nyabadzaa et al. Transition (1) represents infection of susceptibles through contact with a suffcient number of infectives, called the primary infection. Transitions (2) and (3) represents TB reinfection through exogenous reinfection and endogenous reactivation. Transition (4) represents recovery from active TB.

