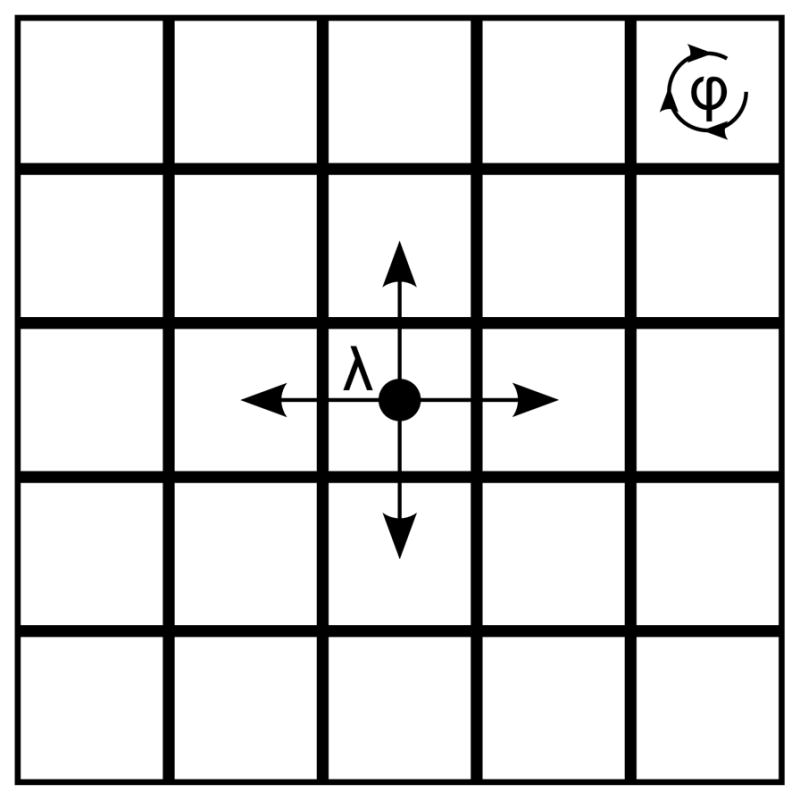
Figure 7.

Representation of a community as a square lattice on ℤ2. Each site represents a cluster and neighbours of a cluster are the sites which have a common border to the site of the cluster. Inter-cluster transmission rate is λ, and within cluster transmission rate is φ.
