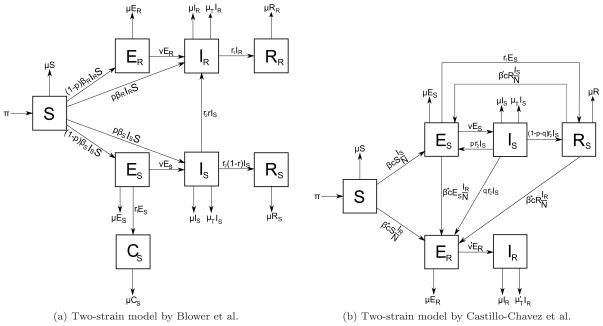
Figure 9.
a) Two-strain model by Blower et al. b) Two-strain model by Castillo-Chavez et al. β* is the probability that treated individuals become infected by one DR-TB individual per contact per unit time. v′ is the progression rate from latent TB to active TB for DR-TB cases. is the mortality rate due to DR-TB. p and q are the proportions of infected individuals who did not complete treatment and became latent DS-TB and DR-TB case respectively.

