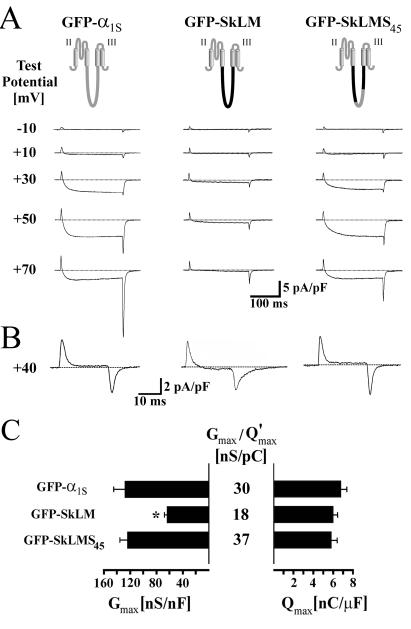
Figure 2.
Restoration of retrograde coupling after insertion of α1S
residues 720–764 into the Musca II-III loop (chimera
GFP-SkLMS45). (A) Representative whole-cell
Ca2+ currents recorded from dysgenic myotubes expressing
GFP-α1S (Left), GFP-SkLM
(Center), and GFP-SkLMS45
(Right). After a prepulse to inactivate T type currents
(24), macroscopic Ca2+ currents were elicited by 200-ms
step depolarizations from a holding potential of −80 mV to the
indicated test potentials. Current amplitudes were normalized by linear
cell capacitance and are expressed as pA/pF. (B)
Representative immobilization-resistant intramembrane charge movements
measured at +40 mV after blocking Ca2+ currents with 0.5 mM
Cd2+ and 0.1 mM La3+, recorded from cells
expressing the same three constructs shown above. (C)
Average maximal Ca2+ conductance
(Gmax, Left) and charge
movement (Qmax, Right) and
ratios of
Gmax/Q (Center) for GFP-α1S, GFP-SkLM, and
GFP-SkLMS45. The asterisk indicates a statistically
significant (P < 0. 001) difference in average
Gmax from the other two constructs after
comparison by an unpaired two-sample t test. No asterisk
indicates lack of statistically significant difference
(P > 0.05). (Bars = mean ± SEM of
12–20 recordings.)

