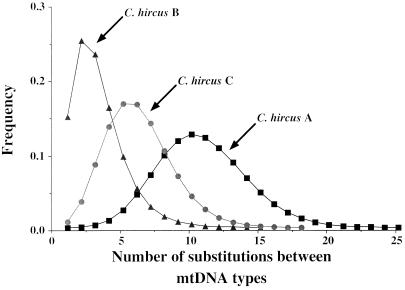
Figure 3.
Mismatch distributions (i.e., pairwise sequence-difference distributions) for mtDNA types from the major lineage of goat sequences, C. hircus A, and from the two smaller lineages, C. hircus B and C. A signature of population growth (i.e., a bell-shaped distribution) is clearly evident in the distribution for all three clusters of sequences, as would be expected for populations expanding after the domestication of relatively few founder-individuals (25). The means of the distributions are different, suggesting different expansion dates for each of the three goat lineages. The Asian lineage (C. hircus B) displays the most recent expansion date.

