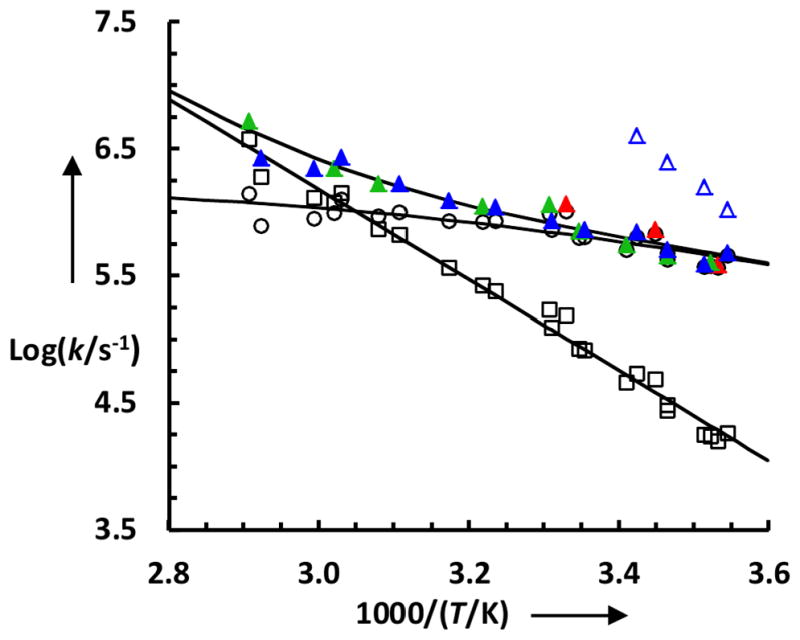
Figure 4.

Conformational relaxation rate constants (solid symbols) of 13C-TC10b obtained with a probing frequency of 1580 cm−1 (red), 1612 cm−1 (green), and 1664 cm−1 (blue), respectively. The blue open triangles represent the relaxation rates of the fast kinetic phase observed at 1664 cm−1. The black open symbols represent the global folding (circle) and unfolding (square) rates of the protein.
