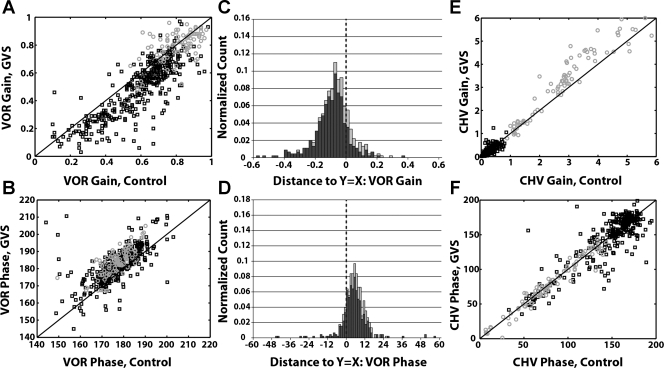
Fig. 2.
Comparison of eye and head movement responses with and without anodal GVS. A: VOR gain for control vs. paired anodal GVS cycles. B: VOR phase for control vs. paired anodal GVS cycles. C: VOR gain is reduced during anodal GVS: distribution of distances of points in A from the unity slope line (called residuals in text). D: VOR phase is increased during anodal GVS: distribution of distances of points in B from the unity slope line. E: head movement response gain (CHV) for control vs. paired anodal GVS cycles. F: head movement phase shifts for control vs. paired anodal GVS cycles. For all panels: black squares or dark bars, low frequencies (<8 Hz); gray circles or light bars, high frequencies (8 and 10 Hz). Solid black lines in A, B, E, and F represent unity slope lines where the plotted responses would be equal. Distributions are normalized by the total number of points across all frequencies in each distribution.

