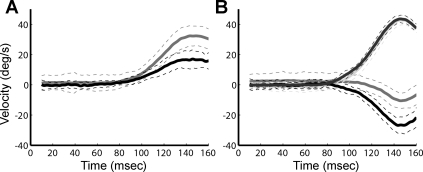
Fig. 4.
Anodal GVS suppression of compensatory eye movements. Each panel shows averaged responses to 30°/s velocity steps during a representative experiment. A: averaged eye-in-space velocity. Black, control; gray, anodal GVS. B: averaged head-in-space velocity. Dark gray, anodal GVS; pale gray, control (note that the pale gray control trace is nearly overlaid by the darker gray anodal GVS trace); gray, eye-in-head anodal GVS; black, control. Dashed lines represent 1 standard deviation.

