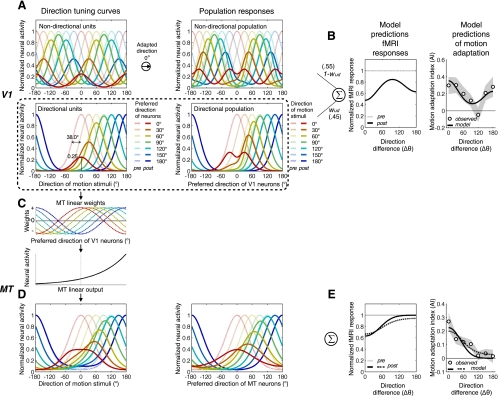
Fig. 10.
Two-stage model of motion adaptation and its predictions of fMRI responses. A: the model assumes that V1 consists of directionally nonselective neurons (top panels) and direction-selective neurons (bottom panels). The curves in light and dark colors describe neural responses before and after adaptation, respectively. In left panels, the curves show direction tuning curves of 7 representative V1 neurons with direction preferences spaced in 30° steps (0∼180°). Here, different colors represent different preferred directions of those neurons. The curves in right panels show population responses to 7 different directions of motion. Here, different colors represent different directions of motion stimuli. B: the model predicts fMRI responses (left) of V1 to a certain direction of motion by summing population responses to that stimulus from both the directional and the nondirectional neurons with certain weights (wud and 1 − wud). The model predictions of motion adaptation indexes (right) are fit to the observed ones from V1/2 (○, means; shaded area, SE). C: only the outputs of direction-selective V1 neurons are linearly integrated in MT neurons according to the cosine weight function. The signal is then translated into a firing rate by a static nonlinearity function. D: the direction tuning curves of representative single neurons with different direction preferences (left) and the population responses to different motion directions (right), respectively. E: the model predictions of pre- and postadaptation fMRI responses (left) and adaptation indexes (right) of MT. Conventions are the same as in B.

