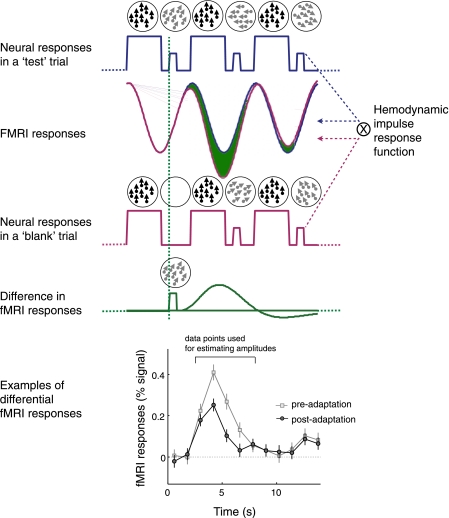
Fig. 3.
Rationale for extracting fMRI responses evoked by a test stimulus. Neural responses to a series of consecutive adapter and test stimuli are expected to fluctuate as a function of stimulus contrast, which is modeled by a boxcar function (blue and red solid lines in first and third rows, respectively). Neural responses are then convoluted by a hemodynamic impulse response function, resulting in time series of fMRI responses. With the assumption of linearity of fMRI signal, the subtraction of the “blank-onset-locked” fMRI responses (solid red curve in second row) from the “test-onset-locked” fMRI responses (solid blue curve in second row) can isolate fMRI responses evoked by a test stimuli (indicated by the green area between the blue and red curves in the second row and by the solid green curve in the fourth row). Graph at bottom shows 2 example time series of differential fMRI response from the middle temporal area (MT) when the test direction was identical to that of the adapter, one before adaptation and the other after adaptation.

