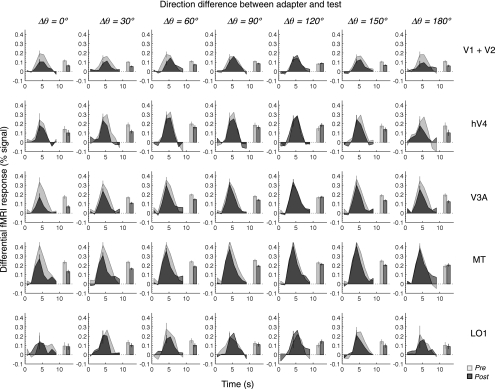
Fig. 4.
Pre- and postadaptation time series of differential fMRI response from representative areas. Time series of differential fMRI responses are sorted in columns by direction difference between the adapter and the test and in rows by different visual areas. The time series in the first row were obtained by averaging the data from V1 and V2. The light and dark gray lines indicate the time series from the pre- and postadaptation conditions, respectively. We averaged fMRI responses around the peak (the 3rd–7th data points) to compute response amplitudes, which are shown by the light (preadaptation) and dark (postadaptation) gray bars. The error bars on the time series are the means of ±1 SE across all the data points in a given time series; the error bars on the bars are 68% CI estimated by the bootstrap method. The time series were obtained by averaging the data from the 3 subjects.

