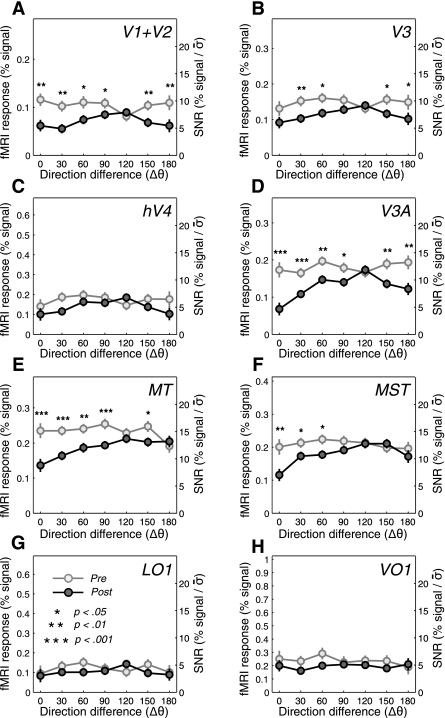
Fig. 5.
Pre- and postadaptation differential fMRI response amplitudes. A–H: the amplitudes of differential fMRI responses (bars in Fig. 4) are plotted against the direction difference between the adapter and the test. The light and dark gray circles indicate the data from the pre- and postadaptation conditions, respectively. The significant reductions in amplitude after adaptation are indicated by asterisks (*P < 0.05; **P < 0.01; ***P < 0.001; from pairwise 1-tailed t-tests). For comparisons across different visual areas in terms of signal-to-noise ratio (SNR), the y-axes were rescaled by dividing the %signal values with the pooled SEs (σ̄) of all the data in a given area.

