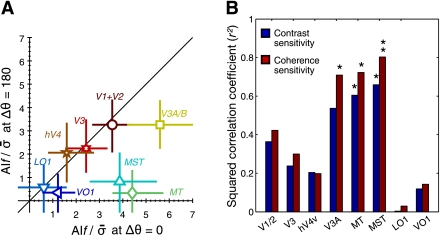
Fig. 7.
Comparisons of cortical adaptation curves across visual areas. A: the magnitudes of fMRI adaptation at the adapted direction on the x-axis is plotted against those at the direction opposite to the adapted direction across visual areas on the y-axis. For comparisons across visual areas, the normalized adaptation indexes (y-axes on right in Fig. 6) were used here. The error bars are the 68% CI of the mean adaptation indexes, which were estimated with the bootstrap procedure. B: squared correlation coefficients (r2) between fMRI and psychophysical adaptation tuning curves are shown separately for coherence (red bars) and contrast (blue bars) adaptation tuning curves across different visual areas. *P < 0.05; **P < 0.01, statistically significant correlations.

