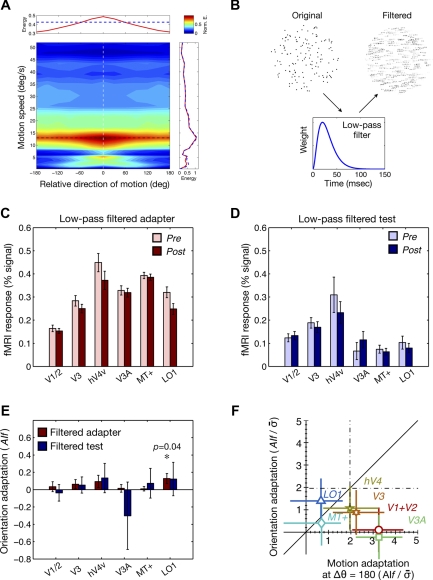
Fig. 8.
Translational motion energy in random-dot stimuli and results of control experiments. A: the average motion energy is represented by color on a map that is jointly defined by motion speed (y-axis) and direction relative to the signal direction (x-axis). The motion energy was normalized by the maximum energy, which occurs at the coordinate defined by the signal direction (white dashed line) and the signal speed (black dashed line). Top inset shows the average motion energy pooled across different motion speeds for coherent motion stimuli (red line) and for random (0% coherence) motion stimuli (blue dashed line). Right inset shows the average motion energy pooled across different directions for coherent motion stimuli (red line) and for random motion stimuli (blue dashed line). B: in the control experiments, in which potential orientation adaptation due to motion streaks was measured, either adapters or test stimuli were modified by applying the temporal low-pass filter (see materials and methods). C: in the first control experiment, where the adapters in the original experiments were low-pass filtered whereas the test stimuli were the same as in the original experiments, we measured fMRI responses to test stimuli whose directions were either the same as or opposite to the adapter. The light and dark red bars indicate pre- and postadaptation responses, respectively. The error bars indicate SEs of the means across trials. D: in the second control experiment, where the adapter stimuli were same as the original experiments whereas the test stimuli were low-pass filtered, we measured fMRI responses to the test stimuli whose directions were either the same as or opposite to the adapter. The light and dark blue bars indicate pre- and postadaptation responses, respectively. E: using the same formula as that for motion adaptation indexes, orientation adaptation indexes were computed for the 2 different control experiments across visual areas. Orientation adaptation was not significant except for the area LO1 in the first control experiment. F: the amounts of potential orientation adaptation in the 2 control experiments were compared with those of motion adaptation in the direction opposite to the adapter in the original experiments. The y-axis is the normalized mean of the orientation adaptation indexes from the 2 control experiments, whereas the x-axis is the normalized motion adaptation indexes from the original experiments, which are the same as the x-axis in Fig. 7A. Values to the left of the vertical dashed line on the x-axis and values above the horizontal dashed line on the y-axis are statistically significant based on pairwise t-tests.

