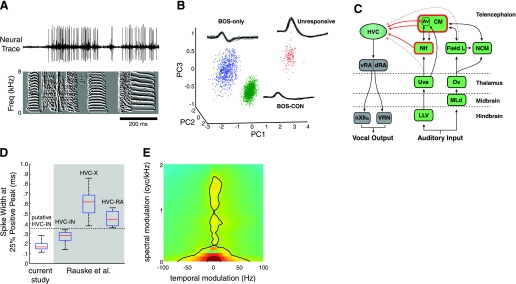
Fig. 1.
Neural recordings from putative single HVC interneurons (HVCIN). A: representative raw trace with a well-isolated single unit (top) during the presentation of conspecific (CON) song (bottom). Song is represented as a spectral derivative, with time on the x-axis and frequency on the y-axis. B: representative example of single unit isolation. Pictured are 3 clearly separated clusters in principal components (PC) analysis (PCA) space (see materials and methods for details) each representing a single unit. In this example, all 3 units were recorded from a single electrode and exhibited 3 very different response characteristics. BOS, bird's own song. C: schematic of verified and potential auditory afferents to HVC. Caudal mesopallium (CM) and the nucleus interface of the nidopallium (NIf) are the only structures known to provide direct auditory input to HVC. Other potential auditory afferents to HVC include the field L complex, nucleus avalanche (Av), and nucleus uvaeformis of the thalamus (Uva). D: spike width characteristics of HVCIN. All recorded neurons in the present study (n = 233, left) had spike widths (measured at 25% of maximal value) that were <0.3 ms. This width was narrower than those of antidromically verified projection neurons (HVCRA and HVCX) recorded in a previous study by Rauske et al. and were comparable in spike width to the population of putative interneurons recorded in that study. Spike widths obtained from the Rauske et al. study are shown in the shaded grey area. E: modulation power spectrum (MPS) of the ensemble of 10 CON zebra finch songs presented at each recording site. The inner and outer black contour lines denote 50% and 80%, respectively, of the total modulation power in the CON song ensemble. Green indicates areas of low power density on the MPS, while red indicates areas of high power density.

