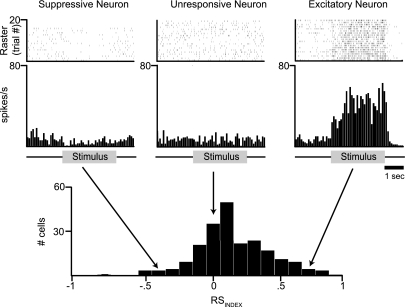
Fig. 2.
HVCIN show three general classes of responses to song stimuli. Raster plot (top) and peristimulus time histogram (PSTH, middle) for each of 3 example neurons to illustrate the general types of responses obtained from HVCIN during the presentation of a song stimulus in awake birds. In all 3 examples, the stimulus was the BOS. Example on left (“Suppressive”) represents a neuron that shows a significant decrease in spike rate during presentation of the song stimulus. This class of neurons showed suppressive responses to all song stimuli. Example at center (“Unresponsive”) represents a neuron lacking responsiveness to the song stimulus. This class of neurons did not respond to any of the song stimuli that were presented. Example on right (“Excitatory”) represents neurons showing excitatory responses to 1 or more song stimuli. Bottom: distribution of RSINDEX values following presentation of BOS for all 233 neurons recorded in this study. Arrows illustrate the RSINDEX values for the 3 example cells. These values were −0.44, −0.05, and 0.71 for suppressive, unresponsive, and excitatory neurons, respectively.

