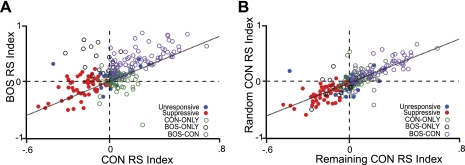
Fig. 3.
HVCIN demonstrate response correlations at the population level. A: scatterplot of CON RSINDEX vs. BOS RSINDEX for all recorded HVCIN (n = 233). B: scatterplot of a randomly picked CON response (Random CON RSINDEX) and the average CON response of the remaining CON stimuli (Remaining CON RSINDEX) for all recorded HVCIN (n = 233). Each unit is color coded by its response class (see text for definition of response classes). The correlations indicate a general responsiveness property that drove increases in spike rate to both BOS and CON. The data also show that BOS elicits greater spike rate increases than CON, while CON responses were more correlated with each other than with BOS. Together these observations suggest that BOS bias may be driven by a property that is separate from responsiveness.

