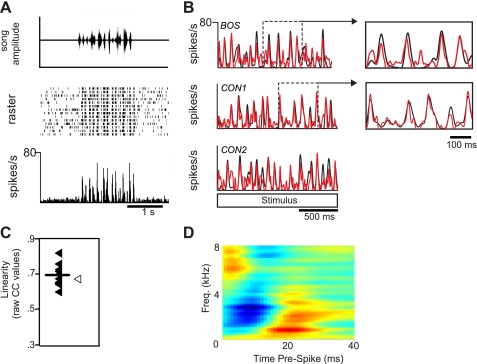
Fig. 6.
Response profile of a highly linear BOS-CON neuron. A: neural response to a CON stimulus. This neuron had phasic response peaks that were highly reliable across all trials. Top: song amplitude waveform. Middle: raster plot. Bottom: PSTH. B: this neuron exhibited a high linearity score (mean CC ratio: 0.68) as exemplified by the similarity in the measured (black) and predicted (red) neural responses. In this neuron, the neural response to BOS (black PSTH in B, top) was well predicted by a CON-derived spectrotemporal receptive field analysis (STRF) (red PSTH in B, top, open symbol in C). Neural responses to CON (black PSTHs in B, middle and bottom) were also well predicted by the same CON-derived STRF (red PSTHs in B, middle and bottom, closed symbols in C). Insets in B highlight how well large response peaks could be modeled by CON-derived STRF for both BOS (top inset) and CON (bottom inset) stimuli. C: distribution of linearity scores. Each filled symbol represents the across-trial average of raw CC values for each CON stimulus; the open symbol represents the raw CC value for the BOS stimulus. The line represents the average of all CON CC values. Note that the STRF predicted the response to the BOS stimulus just as well as the CON stimuli. D: best STRF for the neuron shown in A. Green areas on the STRF represent mean firing rate; red and blue areas represent increases and decreases, respectively, in firing rate relative to the mean firing rate.

