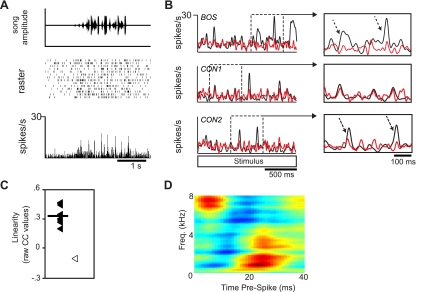
Fig. 7.
Response profile of a moderately linear BOS-CON neuron. A: neural response to a CON stimulus. This neuron, like the neuron depicted in Fig. 6, showed consistent phasic response peaks. B and C: this neuron type showed moderate linearity (mean CC ratio: 0.40) to CON stimuli. The neural response to BOS (black PSTH in B, top) was poorly predicted by CON-derived STRF (red PSTH in B, top, open symbol in C). In contrast, neural responses to CON (black PSTHs in B, middle and bottom) were relatively well predicted (red PSTHs in B, middle and bottom, filled symbols in C). Insets in B highlight how many of the peaks could be well modeled by CON-derived STRF (top inset). In contrast to highly linear cells, many of the larger response peaks during the presentation of CON stimuli (dashed arrows, bottom inset) were as poorly predicted as the responses recorded during the presentation of BOS. C: distribution of linearity scores. Symbols are the same as for Fig. 6. Note here that the STRF predicted the responses to CON stimuli much better than it did the BOS stimulus. D: best STRF for the neuron.

