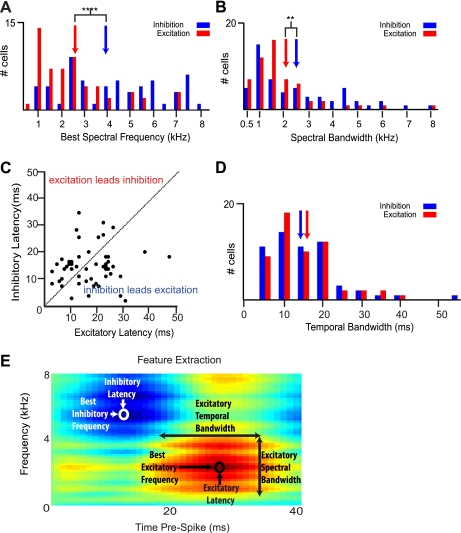
Fig. 9.
STRF-derived spectral and temporal features of HVCIN linear neurons. A: distribution of best spectral frequencies. Neurons subject to feature extraction (all linear neurons, n = 56 cells) showed a broad distribution of best spectral frequencies. Population mean best excitatory frequency (red bars) was significantly lower than best inhibitory frequency (blue bars). Blue and red arrows denote the mean best spectral frequency for inhibition and excitation, respectively,. ****P < 0.0001. B: spectral bandwidth. The majority of cells showed spectrally broadband excitation (red bars) and inhibition (blue bars), with a significant difference in mean spectral bandwidth between inhibition and excitation. Blue and red arrows represent the mean excitatory and inhibitory spectral bandwidth, respectively. **P < 0.01. C: temporal latency. Most cells in the population showed temporal separation of peak excitation and inhibition. The dashed line denotes simultaneous peak inhibition and excitation. D: distribution of temporal bandwidths. Blue and red arrows represent the inhibitory and excitatory means, respectively. There was no significant difference between the means. E: STRF of a representative cell indicating spectral and temporal feature measurements.

