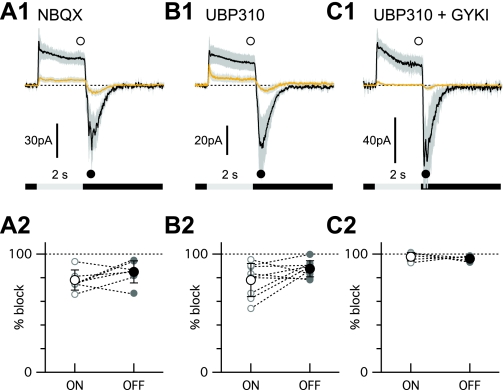
Fig. 3.
NBQX-resistant, light-evoked inputs to OFF bipolar cells. A1, B1, C1: average responses to 2-s diffuse light steps before (black traces) and after (yellow traces) the wash-in of 50 μM NBQX (A1), 10 μM (S)-1-(2-amino-2-carboxyethyl)-3-(2-carboxy-thiophene-3-yl-methyl)-5-methylpyrimidine-2,4-dione (UBP 310; B1), or a combination of 10 μM UBP 310 and 100 μM 1-(4-aminophenyl)-3-methylcarbamyl-4-methyl-3,4-dihydro-7,8-methylenedioxy-5H-2,3-benzodiazepine hydrochloride (GYKI 53655; C1). Shading shows the 95% confidence interval. The initial baseline current has been offset to 0 for comparison. The symbols show the time points used for the measurements shown in the lower panels. A2, B2, C2: summary of percentage block of the ON and OFF response components in individual bipolar cells treated with NBQX (A2), 10 μM UBP 310 (B2), or a combination of 10 μM UBP 310 and 100 μM GYKI 53655 (C2). A2: NBQX, n = 8 cells. Five cells that had similar response kinetics were averaged for the traces shown. B2: UBP 310. Average of 7 of the 8 cells recorded. One outlier was suppressed by only ∼20% and was omitted to perform the statistical comparison with the data in C2. C2: UBP 310 + GYKI 53655. Average from 5 cells.

