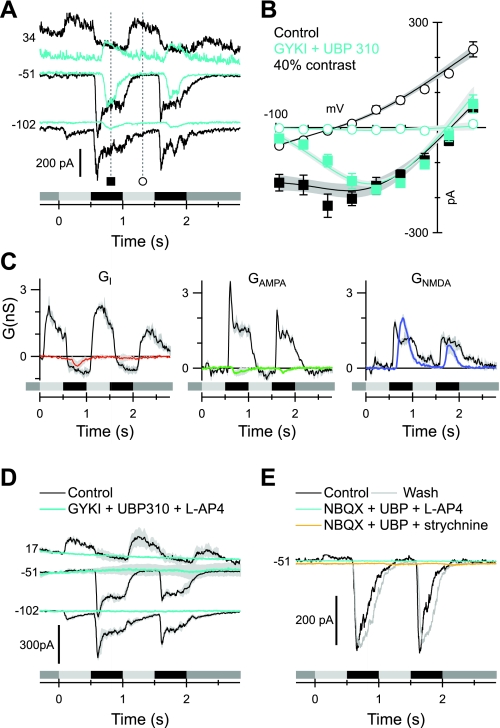
Fig. 8.
Blocking the OFF pathway reveals presynaptic crossover input from the ON pathway. The format is similar to Fig. 6, A–C. Data in B and C show averages from 3 cells. A: currents recorded at the indicated voltages (mV) in a representative cell before (black) and during (cyan) application of 100 μM GYKI 53655 plus 10 μM UBP 310. B: fits to the light-evoked I-V relations at the time points indicated in A. C: conductance components calculated from fits to the average I-Vs as illustrated in B. The colored traces were obtained in the presence of the blocking drugs. Control records are shown in black. Note the complete suppression of the linear inhibitory and excitatory components. D: average current traces (n = 4) showing that the addition of 50 μM L-AP4 blocks the residual NMDA inputs seen in the presence of 100 μM GYKI 53655 plus 10 μM UBP 310 (A). E: similarly, either 50 μM L-AP4 (cyan) or 0.5 μM strychnine (yellow) blocks the residual NMDA input seen in the presence of 100 μM NBQX plus 10 μM UBP 310. In this example, we successfully applied and washed out both L-AP4 and strychnine (gray).

