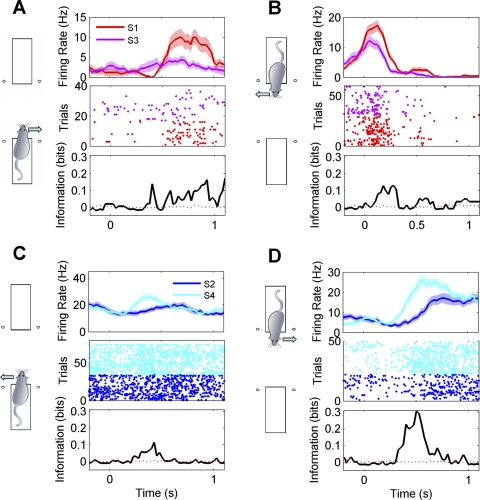
Fig. 3.
Examples of sound-sensitive responses recorded from 4 neurons (A–D). Diagrams at left indicate on which platform and with which reward direction the activity was recorded. Top plots show mean firing rates (±SE) after stimulus onset. Responses to the 2 different sound stimuli (S1 or S3; S2 or S4) tested for each response direction are color coded as indicated. Middle plots show the responses as dot rasters (each dot corresponds to the time of a spike; sequential trials of 1 stimulus are plotted on separate rows). Bottom plots quantify the stimulus dependence of firing rate over time as bits of mutual information in 200-ms sliding time windows. Solid black lines indicate actual information quantity; red dashed lines represent average information across 200 permutations. Bin size = 200 ms, step = 25 ms.

