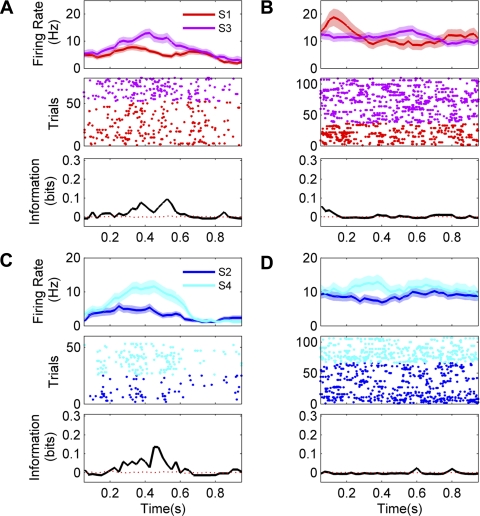
Fig. 5.
Examples of responses for 2 neurons sensitive to sound identity during the behavioral task but not during passive listening. Top plots show mean firing rates (±SE) after stimulus onset. Middle plots show the responses as dot rasters. Bottom plots quantify the stimulus dependence of the firing rate over time as bits of mutual information in 200-ms sliding time windows. Black lines indicate actual information quantity; red dashed lines represent average information across 200 permutations. Bin size = 200 ms, step = 25 ms. The first neuron fired more vigorously to S3 than to S1 during the discrimination task (A) but did not show significant sound coding when the same stimuli were presented passively (B). The second neuron was excited by the onsets of each of the sounds during the discrimination task (the triplets of bursts in C are aligned to the triplets of sounds) but showed no stimulus-related modulation during passive listening (D).

