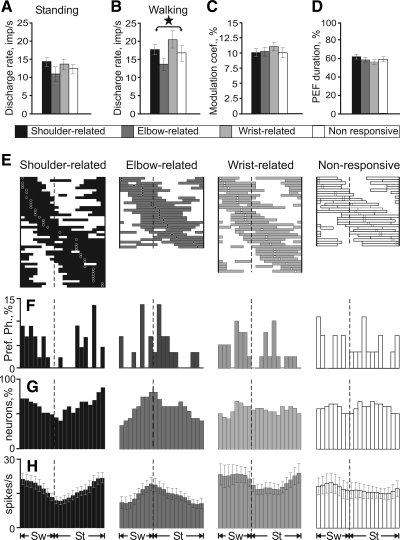
Fig. 4.
Activity of PTNs with receptive fields involving different forelimb joints during simple locomotion. A: discharge rate during standing in different PTN groups. B: discharge rate during walking. C: depth of modulation. D: duration of the PEF. In A–D, error bars are SE and the star indicates significant differences in discharge rates during walking (P < 0.05, ANOVA). E: distribution of PEFs of individual PTNs in the step cycle. Each trace represents PEF of 1 PTN. Circles indicate preferred phase of each neuron. Neurons are rank ordered so that those whose preferred phase is earlier in the cycle are plotted at top of graph. F: distribution of preferred phases of neurons across the step cycle. G: proportion of cells active during the step cycle. The traces from E were summed into a histogram and normalized. H: phase histogram of the average firing rate of PTNs across the step cycle. Error bars are SE. E–H: Sw, swing phase; St, stance phase.

