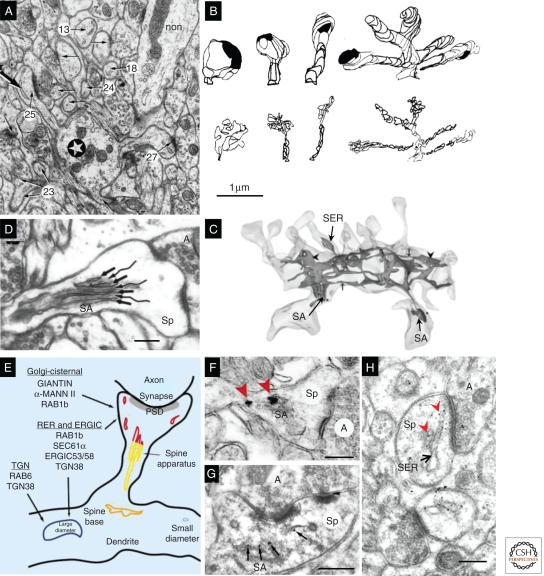
Figure 7.
Dendritic SER. (A) Purkinje cell dendrite (star) and associated spines determined by serial section EM (arrows, some of which are numbered); all of these spines contain SER (e.g., large arrow in spine 25); and a nonspiny dendrite of an interneuron (non). (B) 3D reconstructions of cerebellar dendritic spines (top row, short, medium, long, and branched) and SER tubules (bottom row) illustrate close correlation between spine and SER volume. (C) 3D reconstruction of CA1 dendrite SER, which enters only three spines, two of which have a spine apparatus (SA). (D) The SA has laminated SER (arrows) interspersed with dense-staining material (wavy lines). (E) Summary diagram of Golgi- and secretory-related molecules found in SA and vesicular compartments. (F) SA containing silver-enhanced gold labeling for giantin (red arrowheads), a protein involved in vesicle trafficking through the Golgi apparatus. (G) Post-embedding immunogold labeling for synaptopodin (black arrows), an actin-associated protein, in a spine apparatus from a dendritic spine in the s. radiatum of area CA3. (H) Post-embedding immunogold labeling for IP3 receptors (red arrowheads) along SER in a cerebellar spine head (Sp). Scale bar in B is 1 μm and applies to A–C. Scale bars in D, F, G, and H are all 250 nm. (Panels A and B are from Harris and Stevens 1988a; reprinted, with permission, from the author; panel C is from Cooney et al. 2002; reprinted, with permission, from the author; panel D is from Spacek and Harris 1997; reprinted, with permission, from the author; panels E and F are from Pierce et al. 2001; reprinted, with permission, from Elsevier © 2001; panel G is modified from Deller et al. 2000; panel H is modified from Kelm et al. 2010.)

