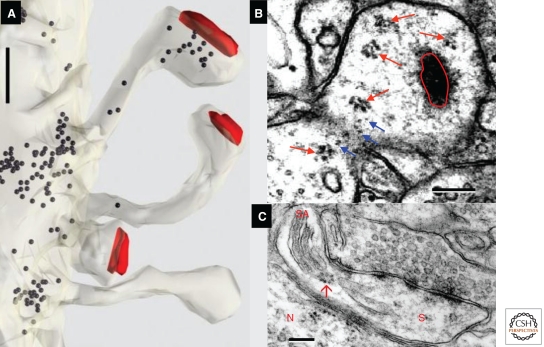
Figure 8.
Ribosomes indicate sites of local protein synthesis. (A) Non-uniform distribution of ribosomes (black dots) in hippocampal CA1 dendrite and spines (red, PSD surface area). (B) Free polyribosomes (red arrows) and putative monosomes (blue arrows) in a large mushroom spine with an en face PSD (encircled in red). (C) Polyribosome (red arrow) associated with endoplasmic reticulum of a spine apparatus (SA) in a dendritic spine (S) adjacent to a neuron (N) in mouse neocortex. Scales, 200 nm. (Panel A is from http://synapses.clm.utexas.edu/anatomy/ribosome/ribo2.stm; reprinted, with permission, from J. Spacek; panel B is modified from Bourne et al. 2007a; reprinted, with permission, from the author; panel C is from http://synapses.clm.utexas.edu/anatomy/ribosome/ribo3.stm; reprinted, with permission, from J. Spacek.)

