
Fig. 3.
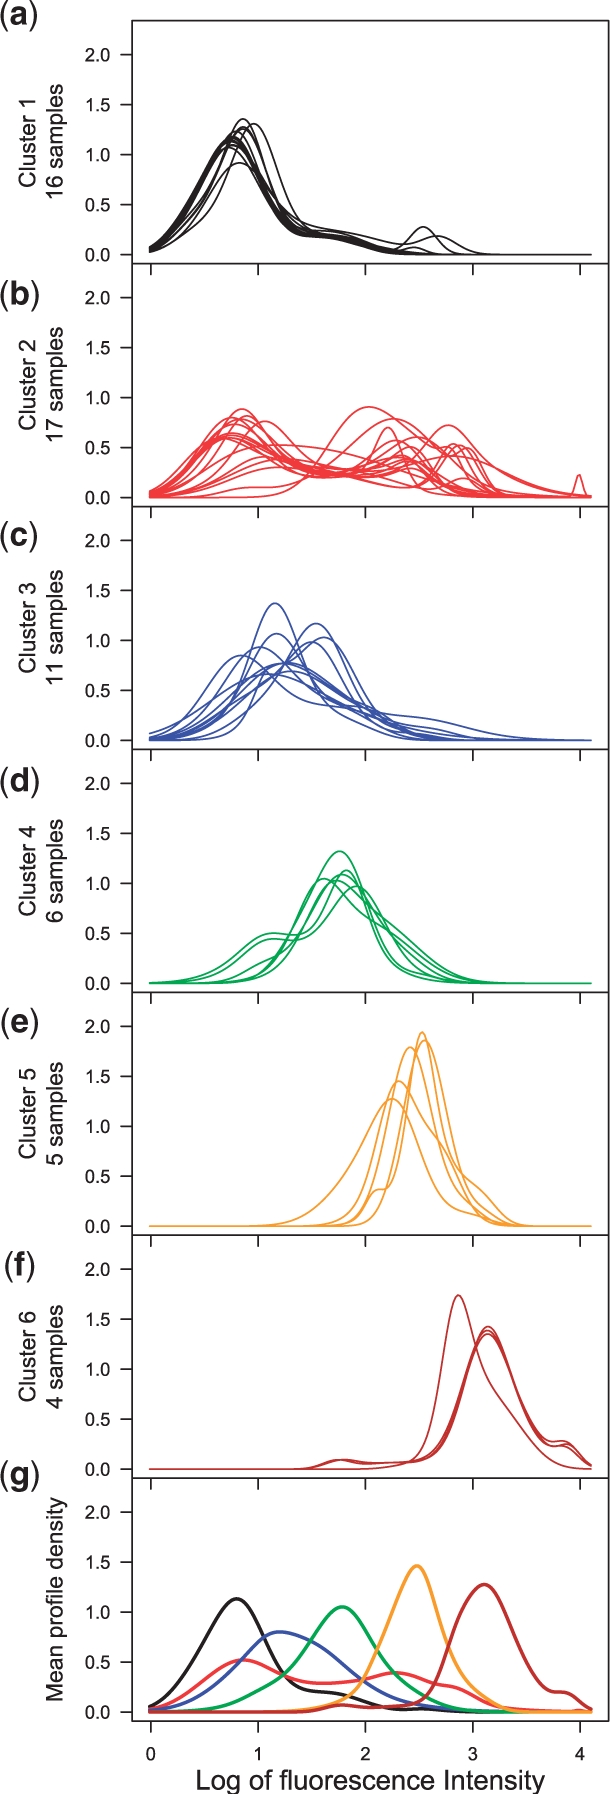
Classification of mAb profiles for spleen: in Step 2 of mAbprofiler, the profiles of all 59 mAb samples in spleen were clustered with non-linear regression of skew t mixture models. The profiles belonging to each of the six clusters (a)–(f) are shown in distinct colors. The joint plot (g) of all six mean profiles in cluster-specific colors allows visual comparison of the cluster templates.