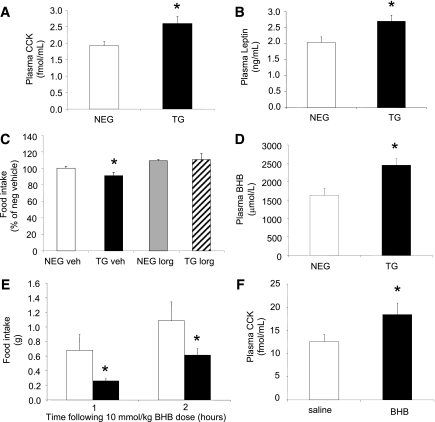
FIG. 5.
Increased satiety hormones in livers of FBPase transgenic (TG) mice. Circulating CCK (A) and circulating leptin (B) levels in hemizygous TG (black bars) and negative (NEG, white bars) littermate mice (n = 6). *P < 0.05 vs. NEG, one-way ANOVA. C: Food intake levels after CCK1 receptor antagonist (lorglumide [LORG], 300 μg/kg) treatment (n = 5). *P < 0.05 vs. all groups, one-way ANOVA. D: Circulating BHB concentrations in hemizygous TG (black) and NEG (white) littermate mice (n = 8). *P < 0.05 vs. NEG, one-way ANOVA. Food intake levels at 1 and 2 h (E) and circulating CCK concentration at 1 h (F) after BHB (10 mmol/kg) administration to C57Bl/6J mice (n = 16). *P < 0.05 vs. NEG, one-way ANOVA. All data expressed as mean ± SEM.

