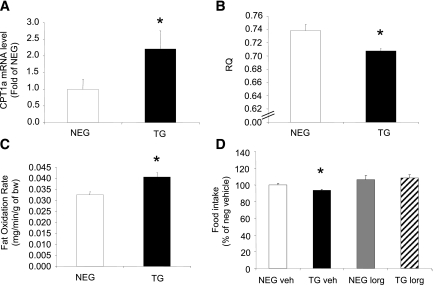
FIG. 6.
Fat oxidation in liver FBPase transgenic (TG) mice. Liver CPT1-a mRNA levels (A), whole-body RQ (B), and whole-body fat oxidation rates (C) in TG and negative (NEG) littermate mice (n = 4). *P < 0.05 vs. NEG, one-way ANOVA. D: Food intake after FAO inhibition with etomoxir (10 mg/kg) treatment (n = 6). *P < 0.05 vs. all groups, one-way ANOVA. All data expressed as mean ± SEM.

