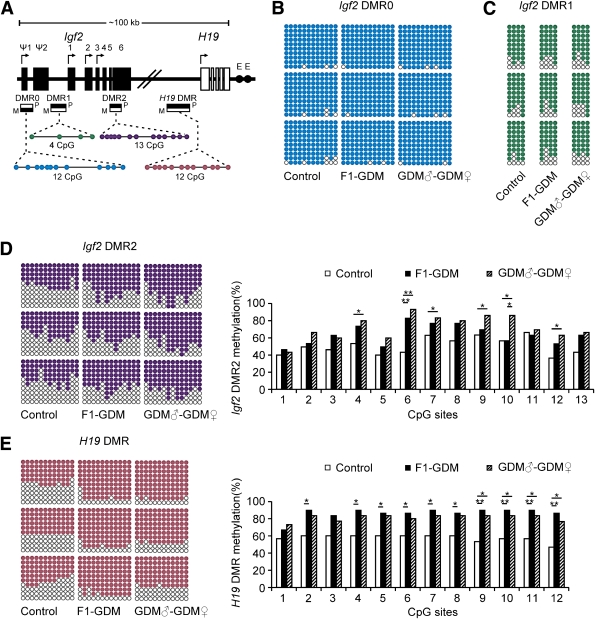
FIG. 5.
Methylation analysis of Igf2/H19 DMRs by bisulfite genomic sequencing PCR. A: Schematic representation of mouse imprinted locus, showing the relative positions of the Igf2 and H19 genes and indicating the location of the four DMRs known to contribute to Igf2 imprinting. The number and position of upstream exons (Ψ1 and Ψ2 for Igf2) and exons are shown as black (Igf2 gene) and white (H19 gene) rectangles with arrows for transcription start sites. Enhancers (E) are indicated as black circles. The locations of the four DMRs within the Igf2/H19 imprinted locus represented by boxes are shaded to indicate preferential methylation of the maternal (M) or paternal (P) allele in each region. B: Methylation status of individual DNA strands of Igf2 DMR0 containing 12 CpG sites. C: Methylation status of individual DNA strands of Igf2 DMR1 containing 4 CpG sites. D: Methylation status of individual DNA strands of Igf2 DMR2 containing 13 CpG sites and the average methylation ratio in each CpG site. E: Methylation status of individual DNA strands of H19 DMR containing 12 CpG sites and the average methylation ratio in each CpG site. Ten clones per mouse; a total of 30 clones per group were sequenced. Each line represents the sequence of a single clone. CpG sites are shown as blank (unmethylated) or filled (methylated) circles. In the histograms, results are expressed as methylation percentage of each CpG site (n = 3 mice per group). *P < 0.05, **P < 0.01 vs. control (χ2 test).

