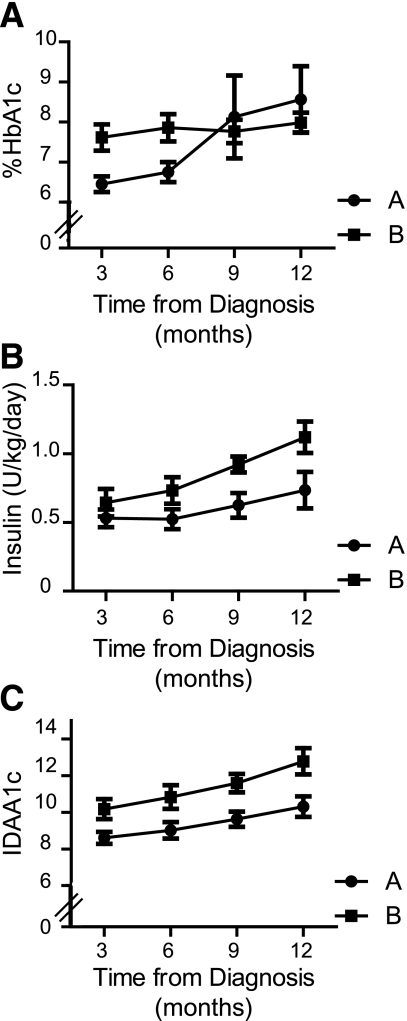
FIG. 3.
Diabetes progression in recent-onset type 1 diabetic patient subgroups. Plasma levels of %HbA1c (A) and total daily insulin dose (units/kg) (B) were recorded at 3 monthly intervals following diabetes diagnosis, from which IDAA1c (C) was calculated. Mean %HbA1c, daily insulin dose, and IDAA1c (± SD) are shown for patients subgrouped according to monocyte expression profile (group A, ●; group B, ■). Group sizes: HbA1c data: n = 8, 7, 7, and 7 for group A and n = 7, 7, 6, and 7 for group B at 3, 6, 9, and 12 months. TDD data: n = 8, 7, 6, and 4 for group A and n = 6, 6, 5, and 4 for group B at 3, 6, 9, and 12 months. Missing data arose when patients missed a clinic visit or commenced a basal/bolus or insulin pump regimen.

