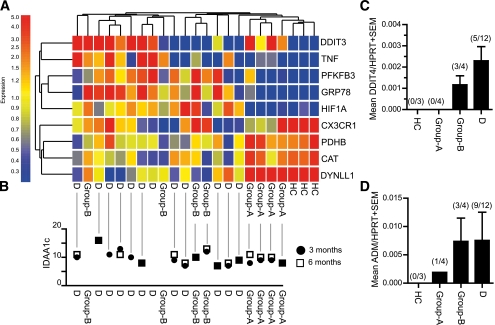
FIG. 5.
Quantitative PCR (qPCR) validation of monocyte gene expression profiles in recent-onset type 1 diabetes. The expression of 9 group B–regulated genes was quantified by real time qPCR in CD14+ monocytes, relative to hypoxanthine-guanine phosphoribosyltransferase expression. Relative expression values for each gene were normalized to the gene’s median expression across all samples. Genes and samples were clustered by Spearman correlation (A). Group A and group B patients were classified previously by microarray. D denotes recent-onset patients who were followed from diagnosis with monocyte sampling at 3 months, but not profiled by microarray. IDAA1c corresponding to each patient profile in A recorded 3 (circles) and 6 (squares) months postdiagnosis (B) is shown. Missing data arose when patients missed a clinic visit or commenced a basal/bolus or insulin pump regimen. Relative expression of DDIT4 (C) and ADM (D) in the patient cohort depicted in A and B is shown. Transcript detection rates appear in parentheses. HC, healthy control subjects.

