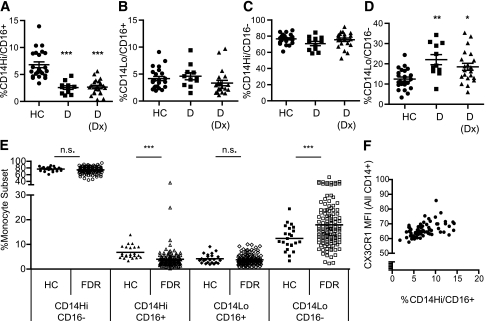
FIG. 6.
Peripheral blood monocyte subset distribution in type 1 diabetic patients and their at-risk relatives. The percentage of monocytes in each of the 4 monocyte subsets was determined by flow cytometry analysis of surface CD14 and CD16 expression in whole PB. A–D: PB monocyte subset distribution was determined for healthy control subjects (HC) (circles), long-standing type 1 diabetic patients (D, squares, >12 months after diagnosis), recent-onset type 1 diabetic patients within 3 months of diagnosis (D[Dx], triangles). PB monocyte subset distribution in healthy control subjects (filled shapes) and FDR (unfilled shapes) (E) is shown. Correlation between %CD14+/CD16+ monocytes and monocyte CX3CR1 surface expression (F) is shown. ***P < 0.0001; **P < 0.01; *P < 0.05.

