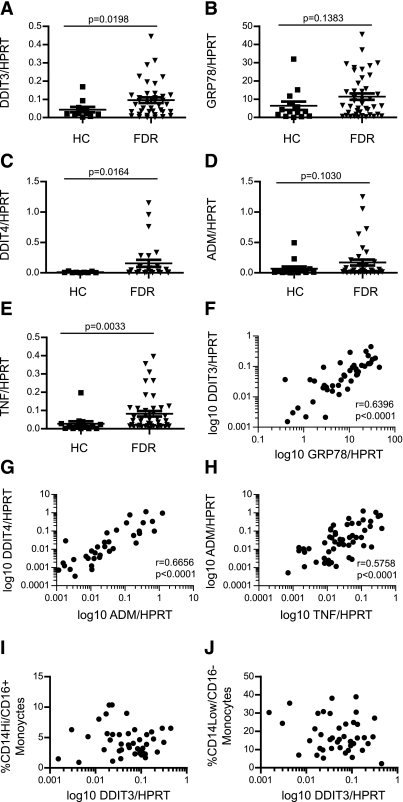
FIG. 7.
Elements of the type 1 diabetes group B expression signature detected in healthy FDR PBMC. Expression of DDIT3 (A), GRP78 (B), DDIT4 (C), ADM (D), and TNF (E) in PBMCs from type 1 diabetic FDR or healthy children (HC) was quantitated by PCR. Correlation between DDIT3 and GRP78 expression levels (F) is shown. Correlation between DDIT4 and ADM expression levels (G) is shown. Correlation between TNF and ADM expression levels (H) is shown. Correlation between DDIT3 expression and %CD14Hi/CD16+ (I) and %CD14Low/CD16− (J) monocytes in PB is shown. P values for group comparisons (A–D) were generated by Student t test (with Welch's correction where variances were significantly different, as determined by F test). Pearson’s correlation coefficient (r) and associated P values are shown in E–G.

