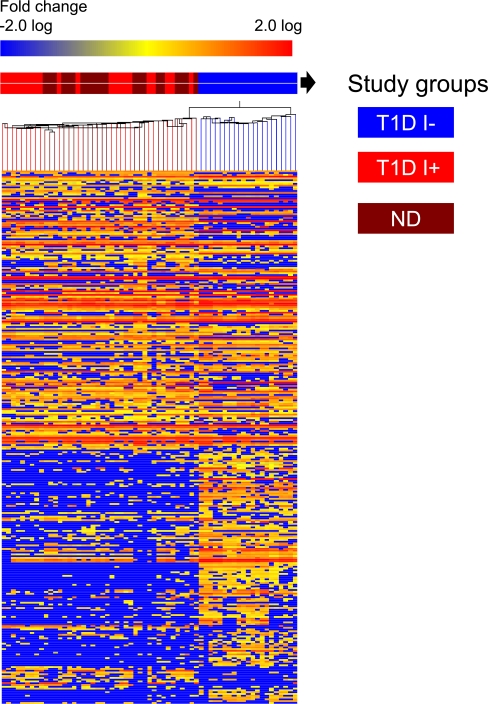
FIG. 1.
Heat map analysis of plasma metabolites in T1D during insulin deficiency (I−) and insulin treatment (I+) and comparison with ND. Metabolite perturbations in plasma were calculated based on the median for each metabolite level of three independent biological replicates of plasma samples from each study participant. Each row represents a metabolite, and each column depicts a subject. The study groups are color coded as follows: insulin-deprived (I−) T1D is denoted in blue, insulin-treated (I+) T1D is denoted in red, and ND groups are denoted in maroon. The fold change in metabolite levels is color coded: red pixels, upregulation; blue, downregulation; yellow, no significant change. Metabolites such as acetate, lactate, acetoacetate, hydroxybutyrate, gluconate, hydroxy adipate, carnitines, glucosamine, and taurocholate including amino acid (e.g., leucine, isoleucine, valine, N-methyl histidine, keto glutarate, glutamate, alanine, phenylalanine) were all found to be elevated in I− T1D (Supplementary Table 4). A consistent decrease was observed in other metabolites, e.g., hydroxypyridine, nicotinamide, hydroxyl nicotinic acid, adipate, methylthioribose, uridine, xanthine, hypoxanthine, methylguanosine, N-acetyl tryptophan, pipecolate, homoserine, aldosterone, arachidonyl lysolecithin, phosphoethanolamine, etc.

