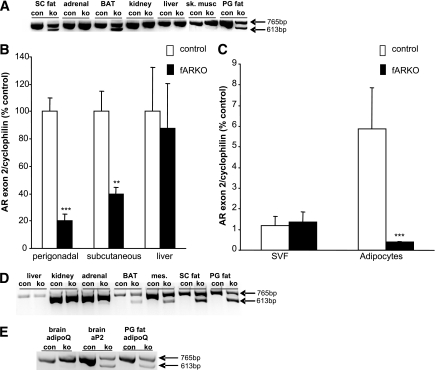
FIG. 1.
Generation of male fat-specific AR knockouts. A: Deletion of AR in the fat was determined using RT-PCR spanning exon 2. Only the larger 765bp floxed band was seen in adrenal, kidney, skeletal muscle (sk.musc), and liver. Both bands were identified in subcutaneous (SC) and perigonadal (PG) fat and in brown adipose tissue (BAT) showing deletion of the AR in a proportion of cells in white and brown adipose tissue. B: Quantitative real-time PCR using AR exon 2-specific primers confirmed loss of AR exon 2 in subcutaneous and gonadal fat, but not in the liver of fARKO mice. C: Quantitative real-time PCR using AR exon 2-specific primers confirmed loss of AR exon 2 in the adipocyte fraction only of gonadal fat. D: Deletion of AR in the fat of adipoQ-fARKO mice was determined using RT-PCR spanning exon 2. Only the larger 765bp floxed band was seen in adrenal, kidney, and liver. Both bands were identified in SC fat, PG fat, mesenteric (mes.) fat, and in BAT showing deletion of AR in a proportion of cells in white and brown adipose tissue. E: Deletion of AR exon 2 was determined in the brain using RT-PCR. AR exon 2 was deleted in the brain of fARKO mice generated with aP2-Cre (aP2) but not in mice using adiponectin-Cre (adipoQ). Data are mean ± SEM (n = 8–10). **P < 0.01 control vs. fARKO; ***P < 0.001 control vs. fARKO. bp, base pair; con, control; ko, knockout.

