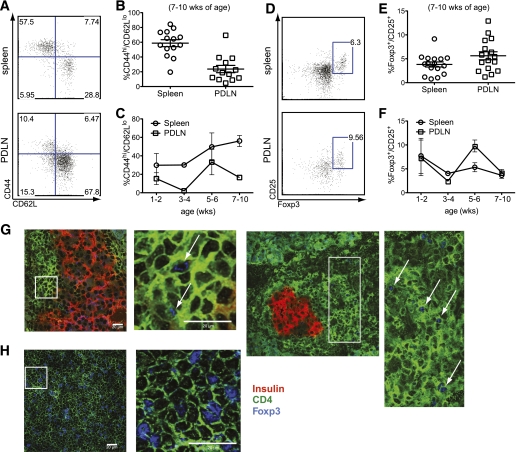
FIG. 1.
BDC12-4.1.RAGKO mice have both B:9-23–specific Teffs and Foxp3+ Tregs in the periphery, but accumulate Teffs as they become older. A and B: Splenocytes and PDLN-derived cells from 7–10-week-old BDC12-4.1.RAGKO mice were analyzed by flow cytometry after gating on the CD4+Vβ2+ population (B:9-23–specific T cells) for the presence of CD44hi/CD62Llo Teffs. Mice showed downregulation of TCRβ expression in the spleen (∼30% of CD4+ cells were Vβ2high) (data not shown). Representative flow cytometric plots displaying the CD44/CD62 L profile in the spleen and PDLNs after gating on the CD4+Vβ2+ population (A), and cumulative data for more than ten 7–10-week-old mice are displayed (B), with each symbol representing individual mice. C: The frequency of Teffs was monitored over time (with age) in the spleen and PDLNs of BDC12-4.1.RAGKO mice. D–F: Tissues from the same mice were analyzed by flow cytometry after gating on the CD4+Vβ2+CD127lo population for the presence of CD25+Foxp3+ (Treg). It is interesting to note that Tregs and Teffs both appear to undergo cyclical changes in the pancreatic lymph node but not the spleen, possibly indicative of recurring changes in the Teff/Treg equilibrium. G: Pancreatic sections from 10-week-old BDC12-4.1.RAGKO mice were prepared and stained for insulin (red), CD4 (green), and Foxp3 (blue). Triple immunofluorescence labeling was performed as described in research design and methods. Higher magnification and capture was performed for the selected region, which is indicated with a white box. H: Spleen sections were stained similarly to serve as a positive control. White arrows indicate the presence of Foxp3+CD4+ T cells. (A high-quality digital representation of this figure is available in the online issue.)

