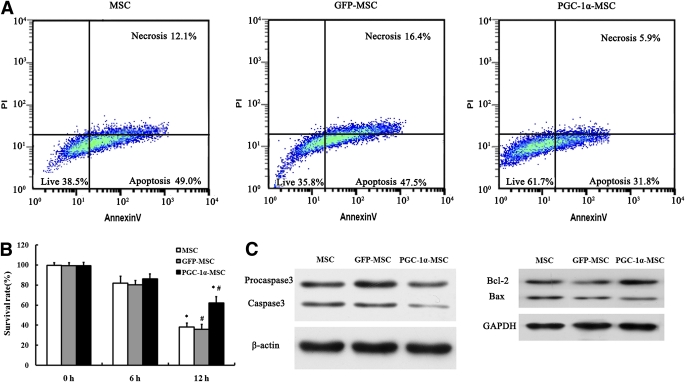
FIG. 3.
Apoptosis analysis of MSCs modified with genes in vitro. A: Three representative density plots of flow cytometry showed that the survival rate in the PGC-1α-MSC group was 61.8%, 35.8% in the GFP-MSC group, and 38.5% in the MSC group after 12 h hypoxia and serum deprivation culture. B: Survival rate in each group after 0, 6, and 12 h hypoxia and serum deprivation culture. *P < 0.01, PGC-1α-MSC vs. MSC; #P < 0.01, PGC-1α-MSC vs. GFP-MSC. C: Western blotting analysis for caspase 3, procaspase 3, β-actin, Bax, Bcl-2, and GAPDH after 12 h hypoxia and serum deprivation culture. (A high-quality color representation of this figure is available in the online issue.)

