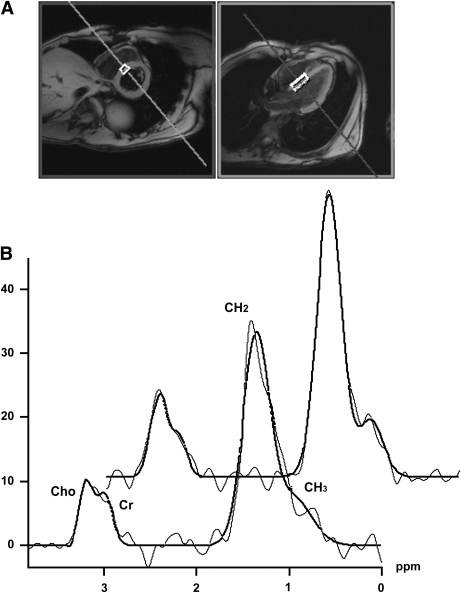
FIG. 1.
A: Position of the volume of interest for 1H MRS placed in the interventricular septum is depicted in the short- and long-axis MR images of the heart. B: 1H MR spectra acquired before (lower trace) and during the sixth hour of combined hyperglycemia and hyperinsulinemia (upper trace). MRS signal (presented in arbitrary units) is represented by the thin line, and the fit of the data, as performed within the spectroscopy tool of the Syngo VB 17 operating platform, is given in bold.

