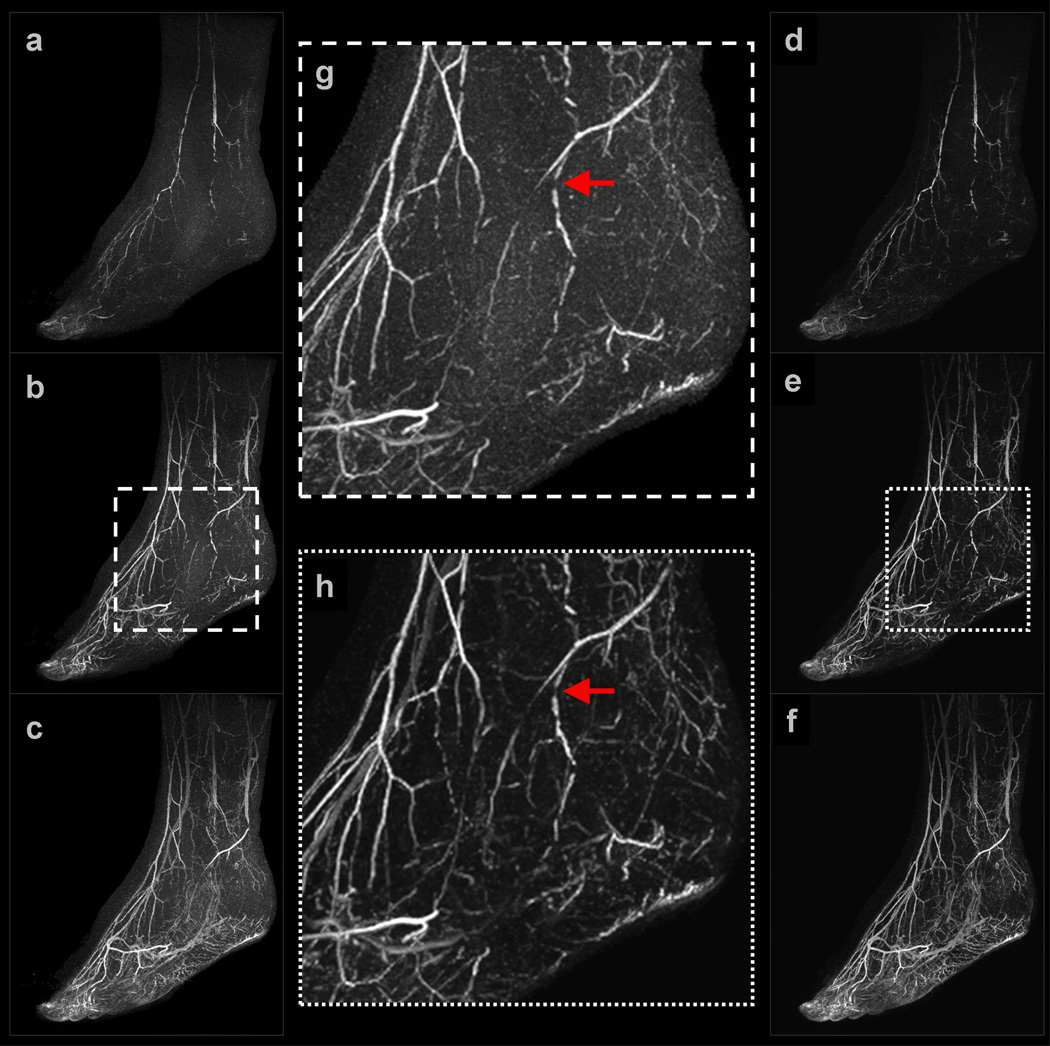
Figure 4.
Selected images from Example 2: (a–c) are sagittal maximum intensity projections (MIP) of early, middle, and late filling stage volumes from a view-shared SENSE+Homodyne reconstruction of the feet; (d–f) are from the corresponding NCCS reconstruction. (g) and (h) are the respective enlargements of an ROI in (b) and (e).

