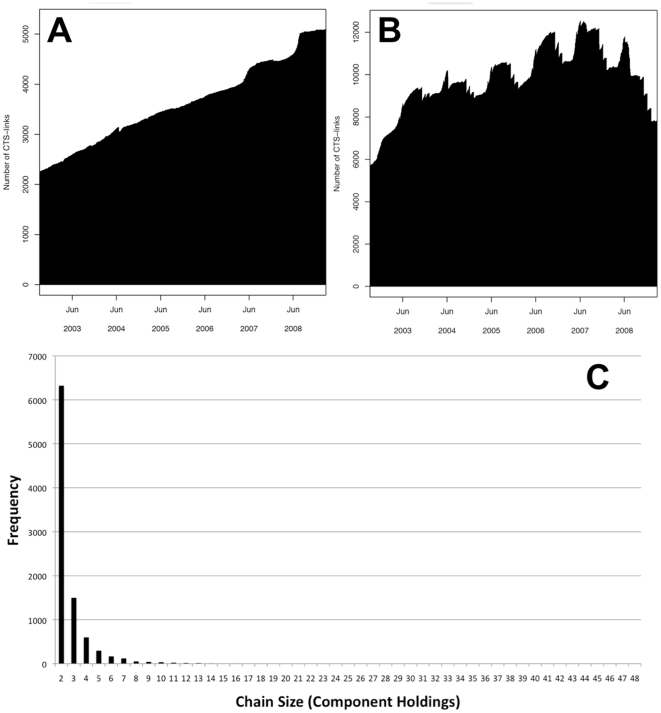
Figure 3. Daily total number of active CTS Links.
The daily number of active CTS Links classed as Shared Facility (A) and Additional Land (B) from 2003 to 2008. (C) Shows the frequency distribution of CTS Chain sizes; the outlier chain of size 242 was removed from this chart, whilst the second largest chain consist of 48 component holdings.

