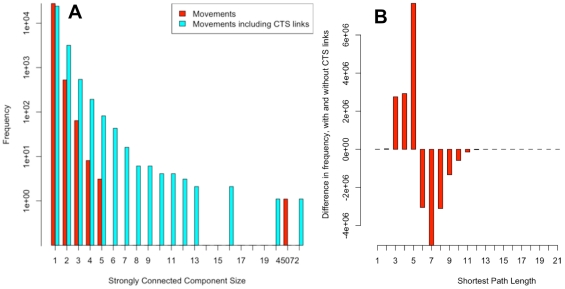
Figure 5. Shortest path analysis of cattle network with and without CTS Links.
(A) Strongly connected component size of the cattle movements network for 2008 with (blue) and without (red) CTS Links. Adding CTS Links increases the size of the largest component (from 45072 to 54786, not shown here) and also increases the size and frequency of the smaller components; (B) Difference between the shortest path length distribution of connected premises in the cattle movements network for 2008 with and without CTS Links. The path length difference is calculated by subtracting the distribution of shortest path lengths for the movement network from the movement network with CTS Links (comparing the same connected premises).

