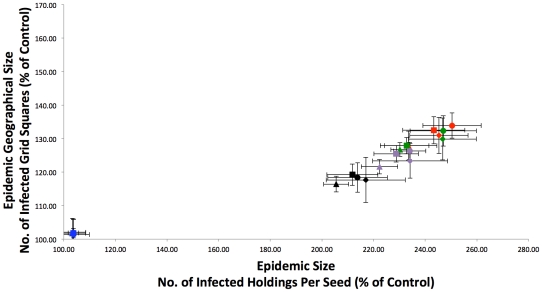
Figure 7. Comparison of epidemic sizes with SOAs.
The model was run including SOAs, with no stock restriction on intra-SOA spread and the following distance limits on intra-SOA spread: No Limit (red), 50 km (green), 16 km (purple), and 8 km (black). In addition, the results from the SOA model with intra-SOA spread restricted to holdings with stock recorded as present is shown in blue. Epidemic size (number of infected holdings per seed) and geographical size (number of infected grid squares per seed) were firstly transformed into percentages of the control epidemic size (with no linked holdings) from the same time of year. Secondly, averages were then obtained for the four quarters of the year (Jan-Feb-Mar[squares], Apr-May-Jun [circles], Jul-Aug-Sep [triangles], Oct-Nov-Dec [diamonds]) giving four data points for each scenario. Error bars are associated with each quarterly average value that represent the 95% confidence intervals for that quarter, assuming a normal distribution and a standard deviation calculated from that quarter's data.

