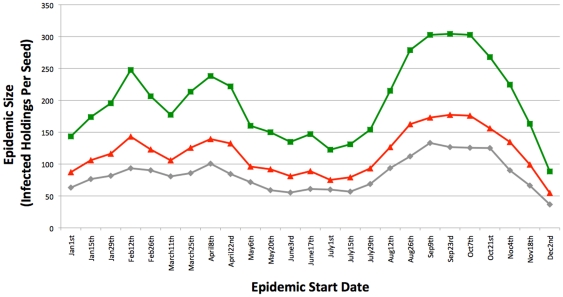
Figure 8. The effect of SOAs on epidemic size – source of infection.
Each data point is the number of infected holdings per seed, generated from 400 stochastic simulations of FMD epidemics starting at that time of year, each with five seeds. The model keeps track of how each holding becomes infected, which can be via one of three routes: 1) Movements; 2) Local spread; and 3) Intra-SOA spread. The grey line shows the total number of infected holdings per seed for the normal Control model, with no SOAs or linked holdings. The grey line is therefore composed of Movement and Local spread infection events only. The red line shows the number of Movement and Local spread infection events (per seed) for the SOA model, which increases the size of epidemics throughout the year. However, the green line shows all (Movements+Local+intra-SOA) infection events (per seed) for the SOA model. As can be seen, the biggest contributor to the increase in epidemic size as a result of including SOAs is intra-SOA spread itself– other premises within the SOA becoming infected. Epidemic sizes are measured in terms of number of infected holdings – not number of infected animals.

