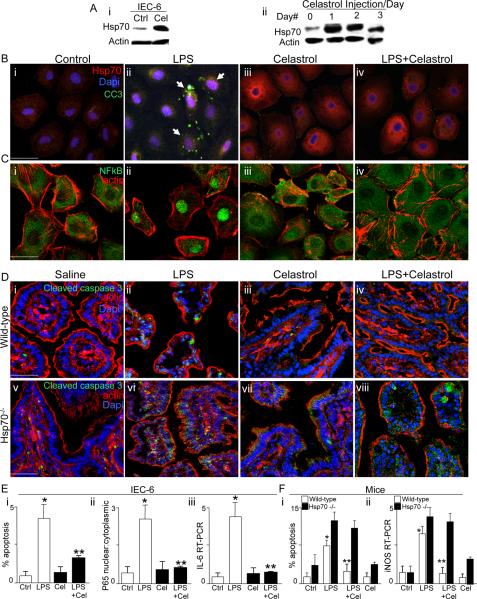
Figure 7. Pharmacologic induction of Hsp70 limits TLR4 signaling in enterocytes in vitro and in vivo.
A: i: Representative SDS-PAGE of IEC-6 enterocytes treated with Celastrol or DMSO and blotted with Hsp70 then re-probed for β-actin; ii: Representative SDS-PAGE of mucosal scrapings from terminal ileum of newborn mice administered Celastrol daily for 3 days. B–C: Representative confocal micrographs of IEC-6 enterocytes treated as indicated and immunostained for Hsp70 (red in B) and DAPI (blue in B) or NFkB (green in C) and β-actin (red in C). Size bar=10 mm. D: Representative confocal micrographs of terminal ileum in newborn wild-type (i–iv) or Hsp70−/− mice (v–viii) that were treated as indicated as indicated and stained for cleaved-caspase 3 (green), DAPI (blue) and β-actin (red). Size bar=250 mm. E: quantification in IEC-6 as indicated. *p<0.05 control vs LPS open bars; ** LPS open bars vs LPS+Celastrol closed bars in 4 separate experiments. F: Quantification of apoptosis (i) and iNOS expression (ii) by RTPCR in the terminal ileum of the newborn wild-type (open bars) or Hsp70−/− mice mouse as indicated. *p<0.05 open bars LPS vs control, **p<0.05 LPS + Celastrol vs LPS open bars; representative of 4 separate experiments, over 10 mice/group. Representative apoptotic cells are indicated by arrows.

