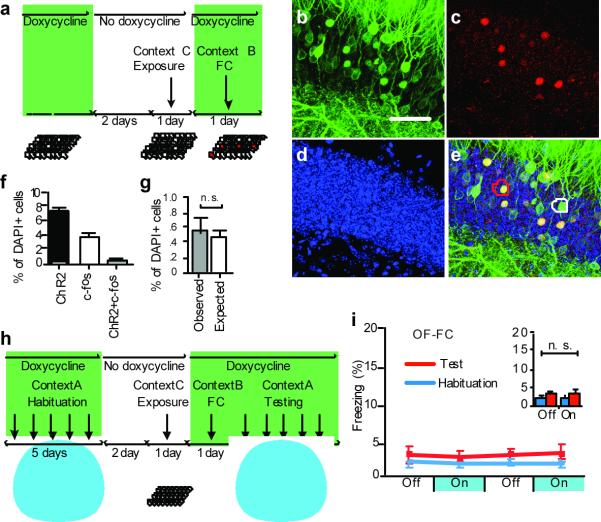
Figure 4. Labeling and stimulation of independent DG cell populations.
a, c-fos-tTA mice injected with AAV9-TRE-ChR2-EYFP were taken off Dox and exposed to context C to label activated cells with ChR2-EYFP (yellow), then put back on Dox and trained with FC in context B to activate endogenous c-fos (red). Representative images of DG from these mice are shown in (b) to (e). b, ChR2-EYFP–labeled cells activated in context C. c, c-fos–labeled cells activated in context B. d, Nuclear marker DAPI. e, Merge. The white and red circles show examples of ChR2-EYFP–positive and c-fos–positive cells, respectively. The c-fos–positive cells in (e) appear yellow because they express both endogenous c-fos (red) and the nuclear-localized c-fos-shEGFP (green) (see Figure 1 legend). f, Percentage of ChR2-EYFP–positive, endogenous c-fos–positive, and double-positive cells among total cells (DAPI+) (n = 5). g, Observed percentage of double-positive cells is the same as what would be expected if the two cell populations were independent (i.e. a product of the observed percentage of ChR2-EYFP–single-positive and c-fos–single-positive cells.) h, Behavior setup for mice exposed to an open field in context C while off Dox and subsequently fear conditioned in context B while on Dox (OF-FC). i, OF-FC mice (n = 5) do not show increased light-induced freezing. Scale bar in (b) 10 μm.

